
Graph theory in Latex
For one of my previous posts, I needed some images of graphs. Initially I have taught, that I will just draw them in Inkscape or some other tool, but after a while I have decided to do something more clever – which might maybe serve me in the future – draw the graphs in Latex.
After a quick search I have found this blog and older posts from the same author
This blog is about drawing graphs in TeX. So what do you need:
TikZ – a graphic system for Tex
Tkz-graph – style with basic graph drawing macros.
Tkz-berge – style with more complex drawing – such as predefined graphs (full graphs, bipartite graphs, grids etc.)
Some TeX editor. I am using Inlage. Which is not expensive and takes care for downloading all the necessary packages.
So here are the graphs and variants which I have used in the previous post:
Graph with 4 edges in a circle:
\begin{tikzpicture}
\GraphInit[vstyle=Welsh]
\SetGraphUnit{2}
\Vertices{circle}{A,B,C,D}
\Edges(A,B,C,D,A,C)
\SetVertexNoLabel
\end{tikzpicture}

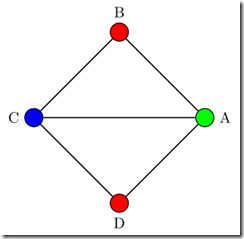
Coloring some of the nodes:
\begin{tikzpicture}
\GraphInit[vstyle=Classic]
\SetGraphUnit{2}
\Vertices{circle}{A,B,C,D}
\Edges(A,B,C,D,A,C)
\SetVertexNoLabel
\AddVertexColor{red}{B,D}
\AddVertexColor{green}{A}
\AddVertexColor{blue}{C}
\end{tikzpicture}
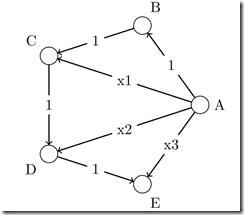
Graph with labeled edges
\begin{tikzpicture} \GraphInit[vstyle=Welsh] \SetGraphUnit{2} \Vertices{circle}{A,B,C,D,E} \SetUpEdge[style={->}] \Edges[label=1](A,B) \Edges[label=1](B,C) \Edges[label=1](C,D) \Edges[label=$1$](D,E) \Edges[label=x1](A,C) \Edges[label=x2](A,D) \Edges[label=x3](A,E) \SetVertexNoLabel \end{tikzpicture}
Graph with positioned vertices.
Using the EA, NOEA and similar macros (EA = East of first vertex define the second vertex, NOEA = Northeast of…)
\begin{tikzpicture}
\SetGraphUnit{2}
\GraphInit[vstyle=Normal]
\Vertex{S}
\NOEA(S){A} \SOEA(S){B}
\EA(A){T1} \EA(B){T2}
\SOEA(T1){F}
\Edges[label=1](S,A)
\Edges[label=1](S,B)
\Edges[label=4](A,T1)
\Edges[label=2](B,T2)
\Edges[label=1](T1,F)
\Edges[label=1](T2,F)
\Edges[style={pos=.25},label=3](A,T2)
\Edges[style={pos=.25},label=2](B,T1)
%Could use this for bending%
\tikzset{EdgeStyle/.append style = {bend left}}
\end{tikzpicture}

Bipartite graph using the berge styles:
\begin{tikzpicture} \grCompleteBipartite[RA=4,RB=3,RS=6]{2}{2} \end{tikzpicture}

For now I am content that I have found this blog and actually I have to say, that drawing graphs in TeX is much easier than I have expected.